Installing matplotlib and Basic plotting in Python using matplotlib
It is possible to draw graphs like MATLAB using Python.
The first thing you should do is to install matplotlib in your system.
After setting up the 'setuptools' (This was introduced the other post in 'A Note of Mr. Forest', you just execute this command.
>>> pip install matplotlib
and then matplotlib will be installed.
And this is basic plotting.
# import plot module
from pylab import *
# values of x axis
x = range(0,100)
# values of y axis
y = []
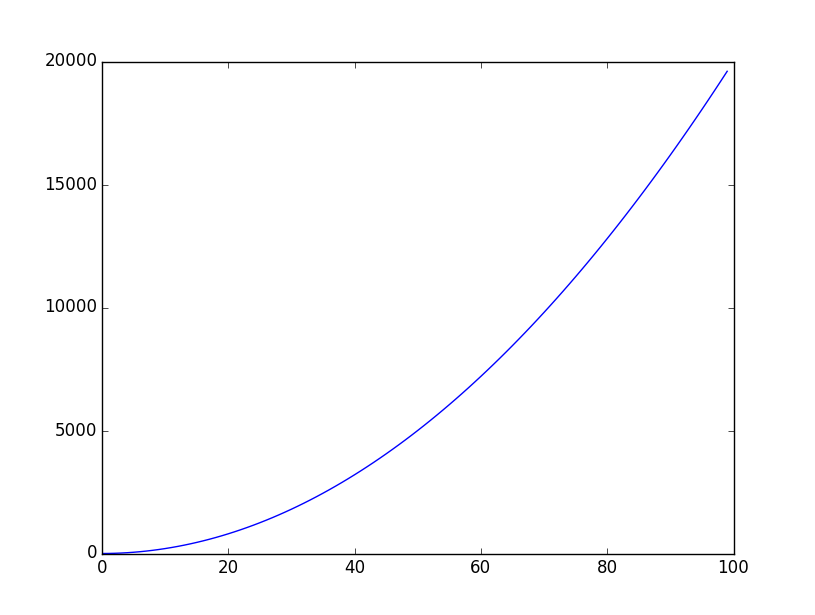
# y = 2*x*x
for i in range(len(x)):
y.append(x[i]*x[i]*2)
# Make figure
figure()
# Build plot
plot(x,y)
# Show the plot
show()
The output like below!
The first thing you should do is to install matplotlib in your system.
After setting up the 'setuptools' (This was introduced the other post in 'A Note of Mr. Forest', you just execute this command.
>>> pip install matplotlib
and then matplotlib will be installed.
And this is basic plotting.
# import plot module
from pylab import *
# values of x axis
x = range(0,100)
# values of y axis
y = []
# y = 2*x*x
for i in range(len(x)):
y.append(x[i]*x[i]*2)
# Make figure
figure()
# Build plot
plot(x,y)
# Show the plot
show()
The output like below!
Thanks
Have Fun!
댓글
댓글 쓰기