라벨이 matplotlib인 게시물 표시

[Python] matplotlib pyplot color map and list of name

이미지
[ref. https://matplotlib.org/3.1.0/gallery/color/named_colors.html ]

Read text file and plot by using Pandas and matplotlib.pyplot in Python

Here is a sample code. import pandas as pd import matplotlib.pyplot as plt filename = 'a.txt' data = pd.read_csv(filename, sep='\t', header=None) plt.plot(data[0],data[1]) plt.xlabel('Raman shift (cm-1)', size=14) plt.ylabel('Intensity', size=14) plt.xlim(1000,3000) plt.savefig('Raman.png', transparent=True) plt.show() This is the link on details of read_csv of pandas. ( https://pandas.pydata.org/pandas-docs/stable/generated/pandas.read_csv.html ) This is the link on details of matplotlib.pyplot. ( https://matplotlib.org/api/_as_gen/matplotlib.pyplot.html ) Thanks, JF

String X or Y ticks label in plotting graph of Python using matplotlib

이미지
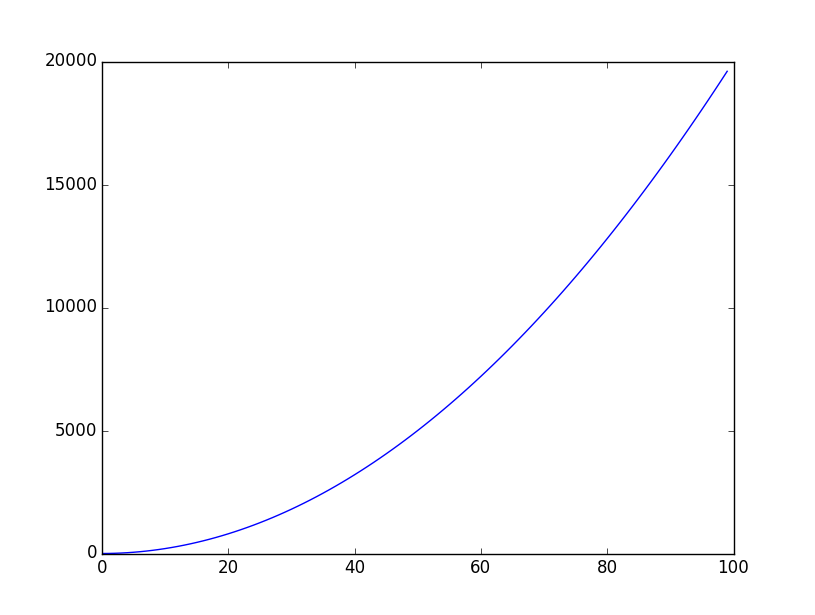
In usual case, we are plotting graphs about integer or float x or y values, but sometimes you need to plot some graphs using string x or y values such as dates, categories. In this case, you can easily draw plot with string values by using xticks or yticks module. In this post, I will show you an example using x string values. Just for integer plot ----------------------------------------------------------------------------- from pylab import * x = [ 1, 2, 3 ] y = [ 2, 5, 10 ] plot(x, y) show() ----------------------------------------------------------------------------- The results is like below Now, for string x values --------------------------------------------------------------------- from pylab import * x = [ 'Mon' , 'Tue' , 'Wed' ] y = [ 2, 5, 10 ] plot( range ( len (y)), y) xticks( range ( len (y)), x, size= 'small' ) show() --------------------------------------------------------------------

Drawing Multiple Plots in One Figure using Python

이미지
One of simple way of drawing Multiple Plots in One Figure using Python is like this, if x and y functions were given, -------------------------------------------------- from pylab import * plotcycle = range (1,10) for i in plotcycle:      xvalues = xfunction(i)      yvalues = yfunction(i)      plot(xvalues, yvalues, label= '%d function' % i) show() -------------------------------------------------- Below graph is an example, (Actually, my working graph for research now) Thanks! Have Fun!

Installing matplotlib and Basic plotting in Python using matplotlib

이미지
It is possible to draw graphs like MATLAB using Python. The first thing you should do is to install matplotlib in your system. After setting up the 'setuptools' (This was introduced the other post in 'A Note of Mr. Forest', you just execute this command. >>> pip install matplotlib and then matplotlib will be installed. And this is basic plotting. # import plot module from pylab import * # values of x axis x = range(0,100) # values of y axis y = [] # y = 2*x*x for i in range(len(x)):      y.append(x[i]*x[i]*2) # Make figure figure() # Build plot plot(x,y) # Show the plot show() The output like below! Thanks Have Fun!